Inspector: Visualize trajectories
The lower part of the inspector window is dedicated to the visualization and annotation of EMA trajectories. Per default, one panel will show up, but up to 3 panels can be activated by clicking on the show panel 2 and show panel 3 buttons.

Each panel consists of three axes: a left one (denomiated as a), and two on the right (b and c). The axes denomiations are important later for the plotting of the sensor trajectories.
The visualization controls themselves are located at the right side under EMA CONTROLS. It contains of a list where the trajectories that have to be plotted are specified, as well as two buttons + and - to add or to remove a trajectory.
Once a trajectory is added, a line with several dropdowns appears.
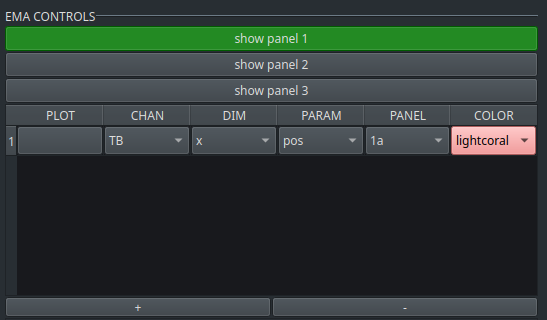
The structure of each row is as follows:
- PLOT: contains a button to plot or to remove the specified trajectory
- CHAN: dropdown containing the channel label as specified in the main window
- DIM: dropdown containing the dimension of the sensor that has to be plotted (x = horizontal, y = vertical, z = lateral). In addition, combinations of these dimensions are selectable (x+y, x+z, y+z)
- PARAM: dropdown containing the parameters pos (position), vel (velocity), acc (acceleartion), tvel (tangential velocity), eucl2D (Euclidean distance in two dimensions), eucl3D (Euclidean distance in three dimensions), dist (one-dimensional distance)
- PANEL: dropdown containing the number of the panel (1, 2, 3) and the specification of the axis (a, b, c)
- COLOR: dropdown containing a selection of colors
The specification of a trajectory is as follows: first, a channel has to be selected. Secondly, the dimension has to be specified, and third, the parameter. The selection of these various options depends on the parameters of interest. For example, if the tongue tip sensor in the vertical dimension has to be plotted, it is necessary to select the respective channel (e.g., TT), the dimension (y), and the parameter (pos). Combinations of channels or dimensions are important for, e.g., tangential velocity or euclidean distances. For a two-dimensional euclidean distance, users have to select, e.g., UL+LL (labels for the upper and lower lip sensors in the main window), the dimension x+y and eucl2D in the parameter column. In case of tangential velocity, the channel, the dimensions (e.g, x+y) and tvel has to be selected.