Inspector: Structure
1. Overview
The inspector window is structured into an upper part for the display of the audio waveform, a spectrogram, and additional information like f0 or the RMS amplitude, and a lower part for the visualization and annotation of EMA data. On the right side of both parts are control elements.
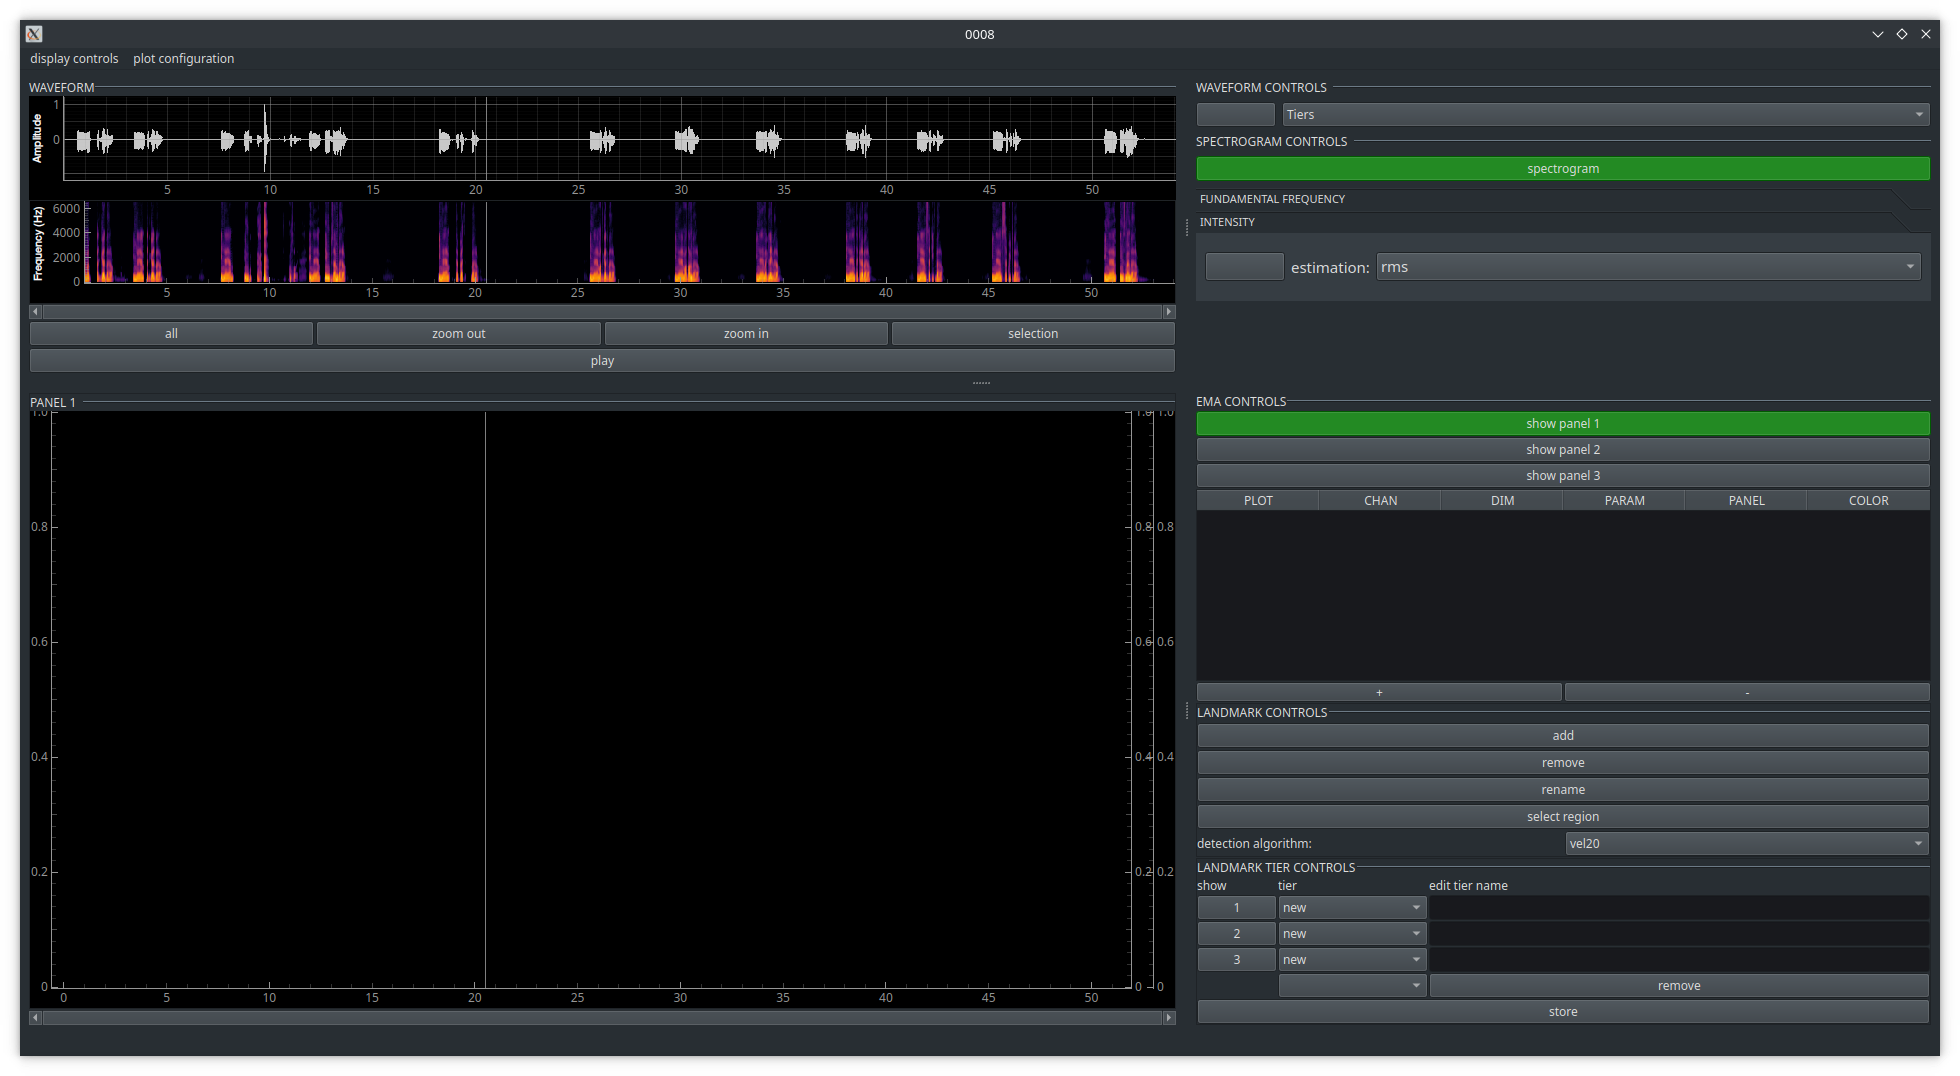
2. Acoustic information
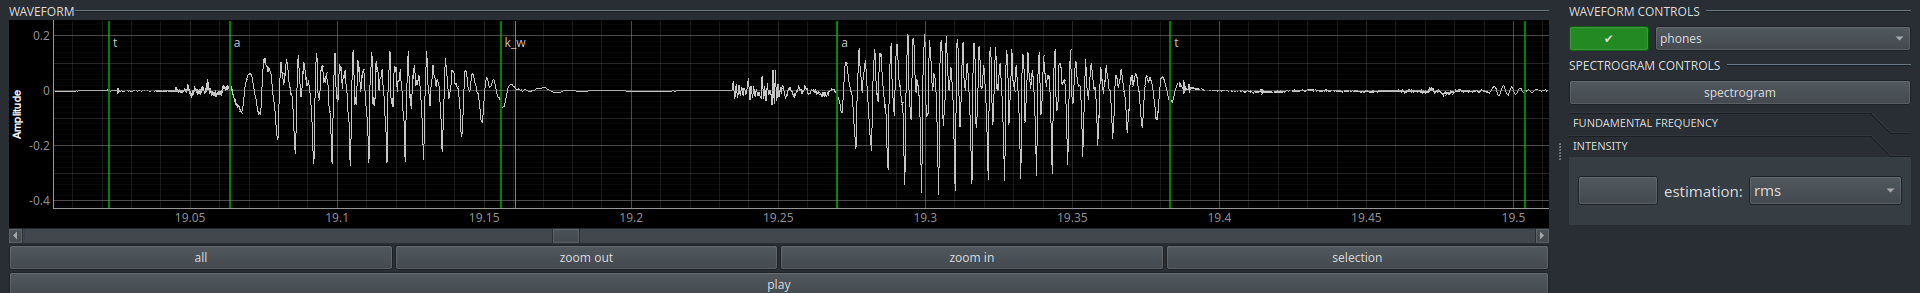
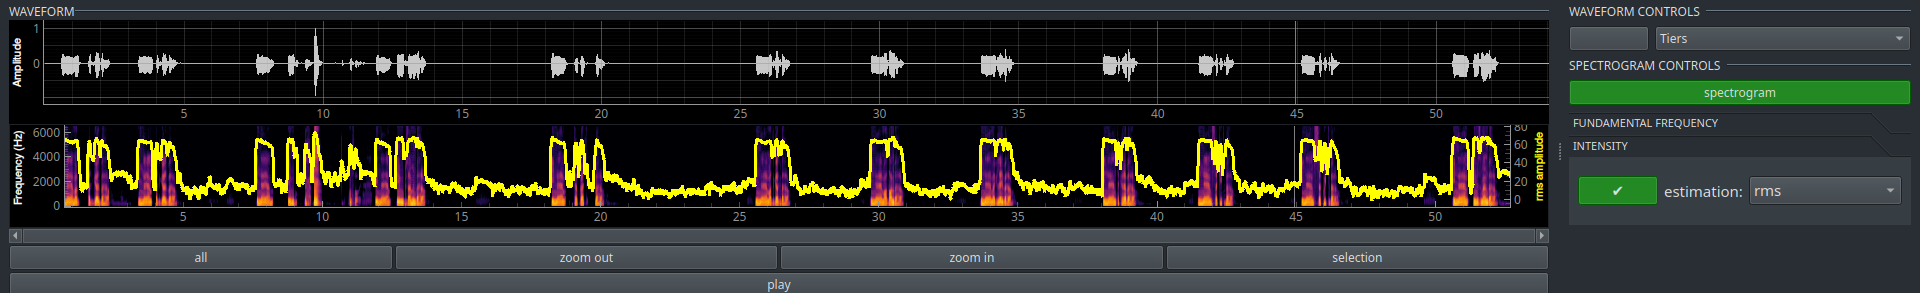
The acoustics part display per default the waveform of the acoustic data. An additional spectrogram can be plotted or removed by activating the show spectrogram button. In addition, the RMS amplitude or f0 (estimated by either the pYin or Yin algorithm) can be plotted by clicking on the respective buttons.
FInally, if acoustic labels are provided, they can be plotted in the waveform area.